

Connectivity Analyzer
The Connectivity Analyzer is a stand-alone, desktop application, allowing you to analyze NiCE APA connectivity with user interface screen elements in your workflow. Captured screen elements can be exported as DPROJ and RESX files, and opened in Automation Studio (from version 7.8). Installation of the APA Real-Time Client is not required.

The Connectivity Analyzer is compatible with the following connectors:
- Web
- Win32:
- Office extension
- Power Builder extension
MS Common Controls and VM extension
Delphi Win32 extension
-
Generic HTML (Chrome, Edge, and Firefox)
- .NET:
- Chromium .NET extension
- Infragistics extension
-
Terminal Emulator
-
WPF:
-
Chromium WPF extension
-
RightNow WPF extension
-
-
SAP
-
JavaNative
- An exported project cannot be reopened using the Connectivity Analyzer. To view the project, open in Automation Studio (from version 7.8).
- Capturing using IBA (Image-Based Analysis) is not supported.
The Project Converter is available for download from the NiCE Software Download Center.
Once you have chosen a screen element to capture, the workflow includes:
- Placing the Connectivity Analyzer window directly over the screen element's window.
- Capturing the screen element.
- Analyzing the recognition results.
- (Optional) Exporting the project.
Capturing a Screen Element
By capturing a screen element, you attain it's identification properties, allowing you to interact with the screen element programmatically. Each screen element must be captured individually.
The Connectivity Analyzer offers two methods for capturing screen elements:
- Capture: The screen element is captured based on its standard identification properties.
- Capture Accessibility: Provides a capturing solution for applications whose user interface elements cannot be captured with any of the standard identification properties. Capture Accessibility should generally only be used when Capture is unsuccessful.
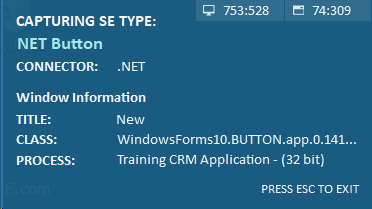
The Capturing Assistant, displayed on the bottom-right of your screen while capturing, provides identifying information of each screen element as you hover over it. Where screen elements overlap, or where they are located close together, the information provided can help ensure that you are capturing the correct screen element.
The SCREEN ELEMENTS panel displays the hierarchy of the captured screen elements. When selecting a screen element from the panel, a screenshot is displayed with a red frame showing the scope of the capture for each level of the hierarchy.
Recognition properties and their values are displayed on the right-hand panel, for each level of the hierarchy. Recognition properties are used to identify the screen element in an automation solution. The Connectivity Analyzer assigns a default recognition property, which can only be changed in Automation Studio.
To capture a screen element:
-
Choose a screen element to capture, and make sure it is visible.
-
Place the Connectivity Analyzer window directly over the screen element's window.
-
Click New Capture.
The window containing the screen element is brought into focus.
-
Hover over the screen element, and wait until a colored border appears around the element.
-
Click the screen element.
A perforated border is displayed around the element while capturing.
-
Upon a successful capture, the screen element's hierarchy is displayed on the SCREEN ELEMENTS panel together with a screenshot, and recognition properties are displayed on the right-hand panel.
To verify connectivity with a captured screen element:
-
Select the screen element from the SCREEN ELEMENTS panel.
-
Click Verify on the bottom-right of the Connectivity Analyzer window.
The window containing the screen element is brought into focus, and a colored border flashes around the screen element.
Exporting a Project
You can save the project containing your captured screen elements by clicking Export Project  on the toolbar. The project is saved externally as DPROJ and RESX files, which you can open in Automation Studio (from version 7.8).
When exporting a project, create a folder with the name of your project, and then select the folder as the path to which to export. The DROJ and RESX files are saved to the folder.
Opening a New Project
You can open a new project in the Connectivity Analyzer by clicking Open Project  on the toolbar.
When opening a new project, if your current project has not been exported, all data will be lost.
Opening a Project in Automation Studio
You can open an exported project in Automation Studio (from version 7.8), and edit Options and Recognition Properties. This is useful if you want to build a solution using the screen elements you captured with the Connectivity Analyzer.