

Run a Solution
Automation Studio allows you to run your solution on the same machine you are developing your solution on for testing purposes. The solution will run just as it will run when deployed on a robot or on an agent's machine.
You can either:
-
Run the whole solution, in which case the solution will run as if loaded on a client (robot or agent's machine).
You can set breakpoints in workflows to pause the solution at those points until you allow the workflow to continue.
For additional guidelines on running solutions involving screen elements, see here.
While a workflow or solution is running, you can monitor the states of all workflows and other assets in the project. You can also manually change the values of some variables and asset properties to help you test your solution.
Run a Specific Workflow
You can run a specific workflow to test it. The selected workflow will run from its start. Any workflow that is invoked by the selected workflow will be run as instructed. If a workflow includes an instruction to display a callout, the callout will be displayed and will be fully functional. The solution will interact with all screen elements as instructed. Event handlers are not activated and cannot be tested in this mode.
You cannot modify or save your project while running a workflow. However, you can navigate around your project, for example, you can open and close workflow tabs, click on workflow steps to see their actions, etc.
Workflows that have input parameter requirements specified so that they can be invoked by other workflows/callouts/event handlers, cannot be run on their own.
To run a specific workflow:
-
Open the workflow.
-
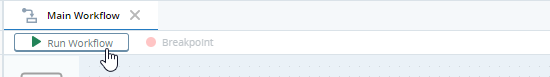
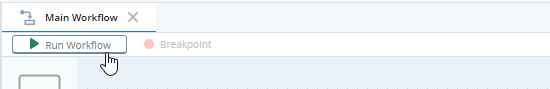
Click Run Workflow.
The workflow starts running. While the workflow is running you can:
-
Monitor its progress and the state of all assets in the project.
-
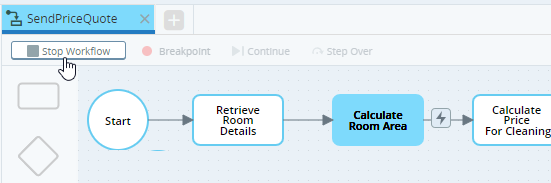
Stop the workflow. Either:
-
Click Stop Workflow.
or
-
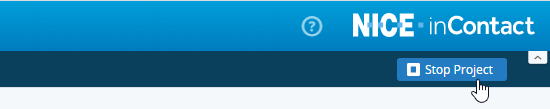
Click Stop Project.
-
When the workflow ends, Automation Studio automatically returns to editing mode. You do not have to manually stop the workflow or exit debug mode.
-

Run a Whole Solution
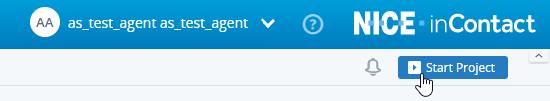
You can run your entire solution to test how it will behave when launched on a robot or agent's machine. To do so, click Start Project.
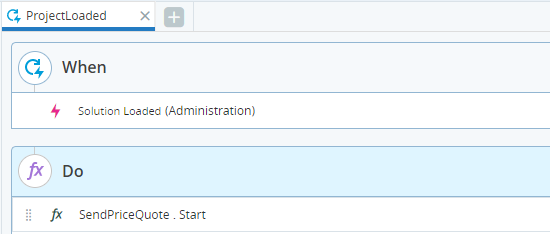
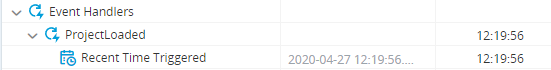
Nothing will happen after starting the solution unless your project includes an event handler that is triggered, for example, by a Solution Loaded event as shown in the event handler below.
You can, however, manually start a workflow by clicking Run Workflow. The workflow will run as when running a specific workflow. Once the workflow ends, Automation Studio does not return to editing mode automatically.
While in Execution mode, you can:
-
Monitor the progress of workflows and the state of all assets in the project.
-
Stop a workflow while it is running.
Open the workflow's tab and click Stop Workflow. The workflow will stop but Automation Studio will not automatically return to editing mode.
-
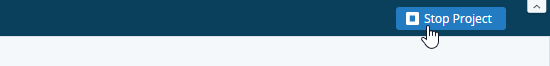
Return to editing mode.
Click Stop Project.
Set Breakpoints in Workflows
You can add breakpoints to steps in your workflows. When a workflow runs (either when running a specific workflow or when running the whole solution), the workflow will pause before starting to run the actions in a step that has a breakpoint set on it. That step will only be run once you give permission. Setting breakpoints is helpful as they allow you to check (and sometimes modify) the states of all variables and asset properties at specific points along a workflow.
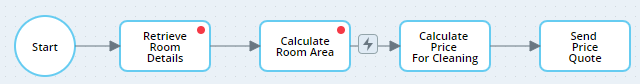
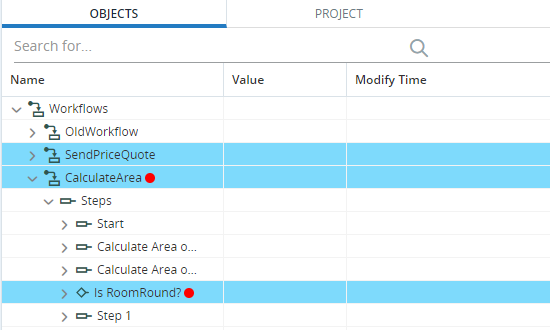
In the workflow below, the two breakpoints indicated by  will pause the workflow before running each of the Retrieve Room Details and Calculate Room Area steps.
You can add breakpoints either before or after clicking Start Project or Run Workflow.
The locations of breakpoints are saved when you save a project. However, you will not be able to save the project if the only change made since the last save was a change in breakpoints.
To insert and remove breakpoints:
-
Open the workflow.
-
Click the step to which you want to add a breakpoint. (The workflow will pause before that step starts running.)
-
Click Breakpoint.
-
The breakpoint is added to the instruction.
-
To remove the breakpoint, click the relevant instruction and click Breakpoint. The breakpoint is removed.

React to Breakpoints in Workflows
When running your solution (either when running a specific workflow or when running the whole solution), whenever a breakpoint is reached, the following notifications appear:
-
A marker
is displayed on the tab of the workflow that reached a breakpoint. -
The step at which the workflow has paused is highlighted. (The workflow pauses before running that step.)
-
A marker
is displayed next to the paused workflow and the step with the breakpoint.


To resume a paused workflow:
-
Open the tab of the workflow that has paused at a breakpoint.
-
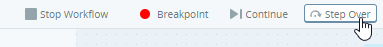
Click:
-
Continue if you want the workflow to continue running normally (until the next breakpoint, if any).
or
-
Step Over if you want the workflow to run just the step at which the workflow paused. The workflow will then pause before the next step as if there was a breakpoint on that step too.
-

Monitor Asset States and Values in the Debug Panel
When running your project (either when running a specific workflow or when running the whole solution), the Assets Panel is restructured as a Debug panel that lets you monitor your workflows, callouts, event handlers, screen elements, and variables.
Below is a partial list of the information displayed in the Debug Panel while running a workflow or solution.
-
Indicates which workflow is currently active.
-
Indicates which step is currently active.
-
Indicates if a step is paused at a breakpoint.
-
Shows the values of each workflow's properties, for example, whether it is paused or running, the last time at which the workflow was started, and its timeout interval.
-
Shows the values of each workflow step's properties, for example, if the step is active, its duration, and when it was last started.
-
Shows the values of each workflow's input parameters, if any. These values are only displayed while the workflow is running. It is useful to set a breakpoint in the workflow to pause execution to give you time to see the values of the workflow's input parameters.

-
Indicates the time at which the event handler was last triggered.
-
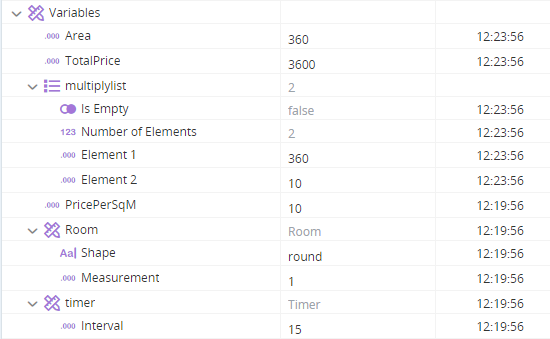
Shows the value of each simple variable.
-
Shows the values of the properties of each complex variable.
-
Shows the number of elements in each list variable, and the value of each element.
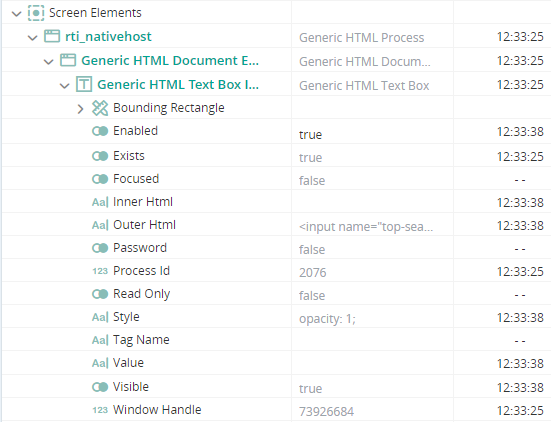
- Shows the values of all properties of each screen element.
-
Shows the values of all properties of each callout.
-
Shows the values of all properties of each callout control.
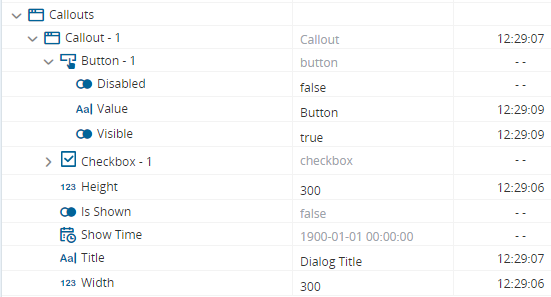
The values of some properties displayed can also be modified, and are displayed in black text instead of gray. This can be useful, for example, to trigger an event handler by manually adjusting the variable or property that the event handler is monitoring for a change in value.
In the example below, a callout is displayed by an event handler when the Boolean variable CalloutTrigger changes value. The automation developer can display the callout by changing the value of that variable manually.